Plotting
-
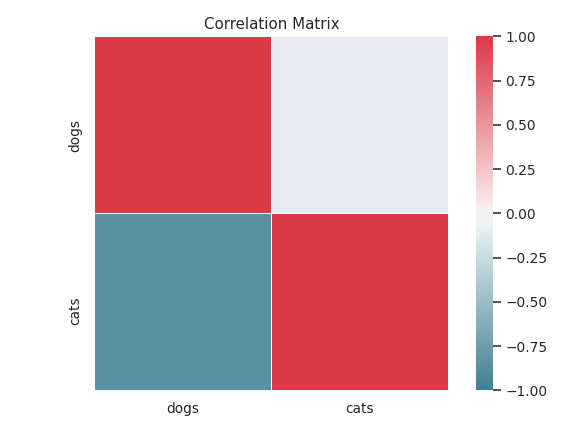
mlflow_extend.plotting.corr_matrix(corr)[source]¶ Plot correlation matrix.
- Parameters
corr (array-like) – Correlation matrix.
- Returns
Figure object.
- Return type
matplotlib.pyplot.Figure
Examples
>>> df = pd.DataFrame([(0.2, 0.3), (0.0, 0.6), (0.6, 0.0), (0.2, 0.1)],
...                   columns=['dogs', 'cats'])
>>> corr_matrix(df.corr())
<Figure ... with 2 Axes>
-
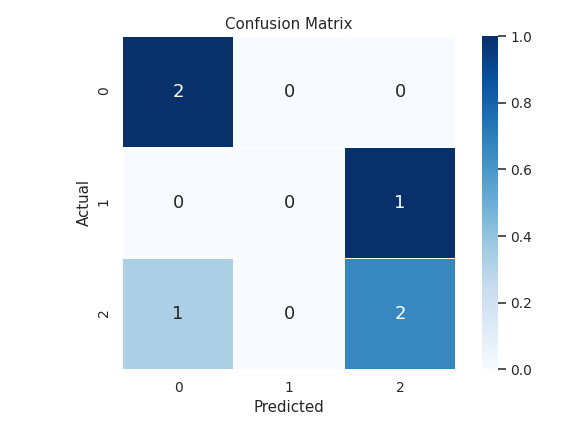
mlflow_extend.plotting.confusion_matrix(cm, labels=None, normalize=True)[source]¶ Plot confusion matrix.
- Parameters
cm (array-like) – Confusion matrix.
labels (list of str, default None) – Label names.
normalize (bool, default True) – Divide each row by its sum.
- Returns
Figure object.
- Return type
matplotlib.pyplot.Figure
Examples
>>> cm = [[2, 0, 0],
...       [0, 0, 1],
...       [1, 0, 2]]
>>> confusion_matrix(cm)
<Figure ... with 2 Axes>
-
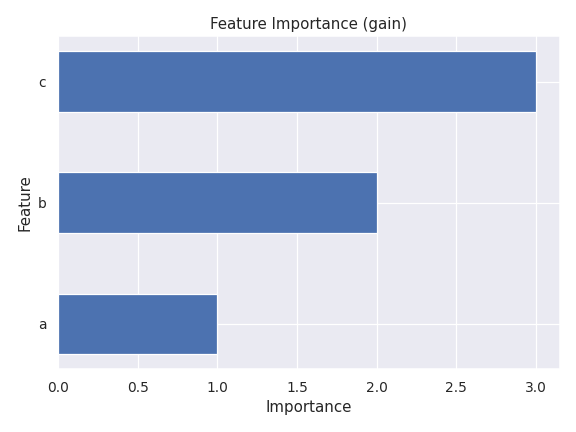
mlflow_extend.plotting.feature_importance(features, importances, importance_type, limit=None, normalize=False)[source]¶ Plot feature importance.
- Parameters
features (list of str) – Feature names.
importances (array-like) – Importance of each feature.
importance_type (str) – Feature importance type (e.g. “gain”).
limit (int, default None) – Number of features to plot. If
None, all features will be plotted.normalize (bool, default False) – Divide importance by the sum.
- Returns
Figure object.
- Return type
matplotlib.pyplot.Figure
Examples
>>> features = ["a", "b", "c"]
>>> importances = [1, 2, 3]
>>> importance_type = "gain"
>>> feature_importance(features, importances, importance_type)
<Figure ... with 1 Axes>
-
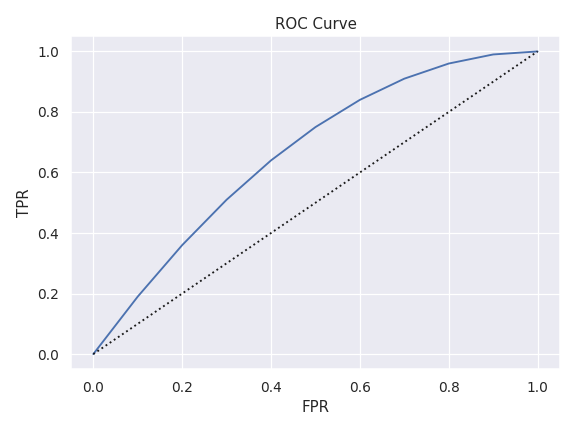
mlflow_extend.plotting.roc_curve(fpr, tpr, auc=None)[source]¶ Plot ROC curve.
- Parameters
fpr (array-like) – False positive rate.
tpr (array-like) – True positive rate.
auc (float, default None) – Area under the curve.
- Returns
Figure object.
- Return type
matplotlib.pyplot.Figure
Examples
>>> fpr = np.linspace(0, 1, 11)
>>> tpr = -((fpr - 1) ** 2) + 1
>>> roc_curve(fpr, tpr)
<Figure ... with 1 Axes>
-
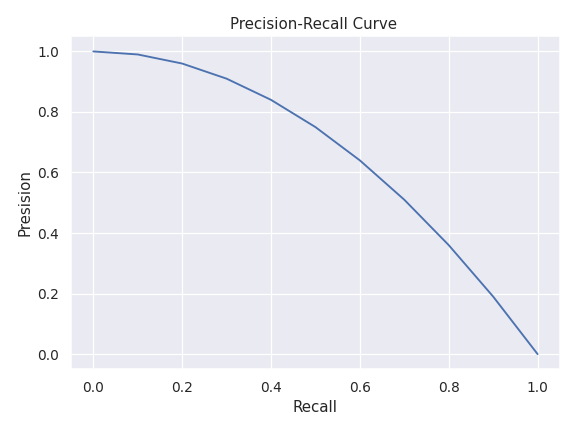
mlflow_extend.plotting.pr_curve(pre, rec, auc=None)[source]¶ Plot precision-recall curve.
- Parameters
pre (array-like) – Precision.
rec (array-like) – Recall.
auc (float, default None) – Area under the curve.
- Returns
Figure object.
- Return type
matplotlib.pyplot.Figure
Examples
>>> rec = np.linspace(0, 1, 11)
>>> pre = -(rec ** 2) + 1
>>> pr_curve(pre, rec)
<Figure ... with 1 Axes>